📊 Total Revenue Analysis
🔍 Objective
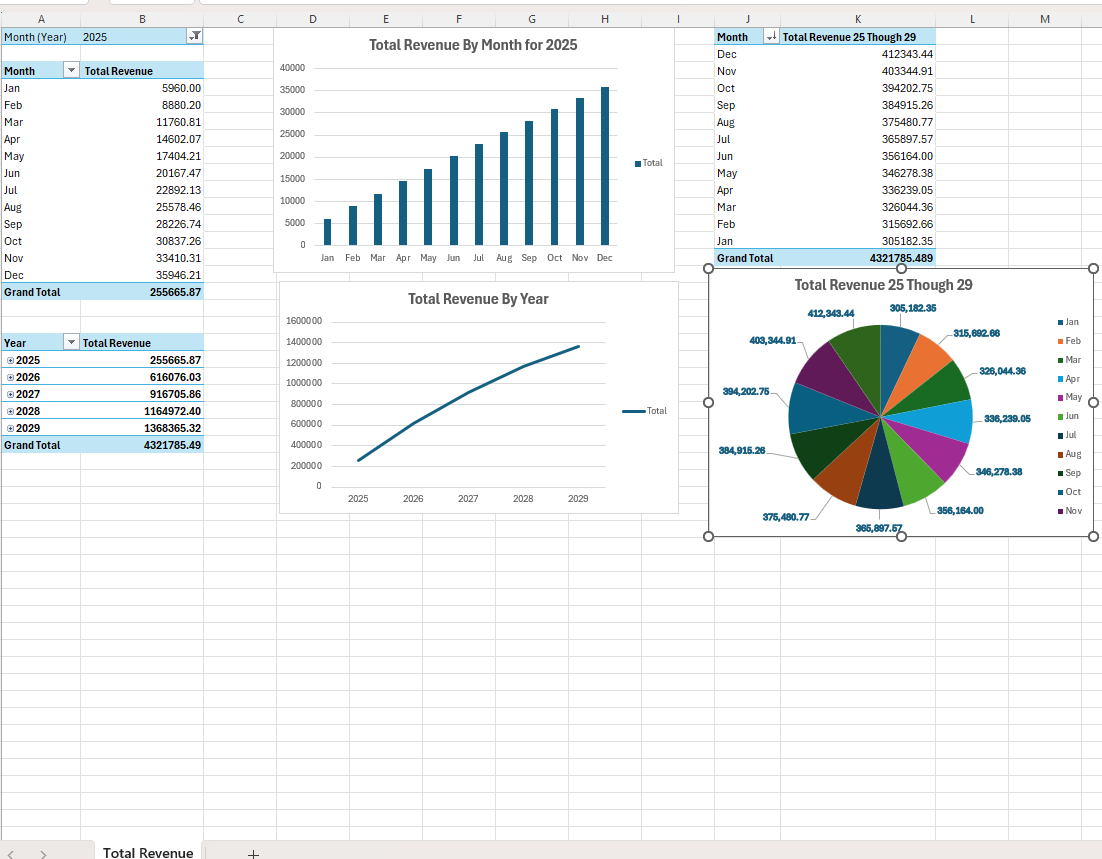
This report visualizes and analyzes the monthly revenue performance for the year 2025, along with a comparative snapshot of total revenues spanning 2025 to 2029.
📈 Monthly Performance (2025)
Progressive Growth:
Revenue increased steadily each month, starting at $5,960 in January and reaching $35,800+ by December.
Top Performing Months:
December marked the highest revenue peak.
November and October also showed strong results, continuing a late-year upward trend.
Growth Pattern:
This consistent month-over-month increase suggests effective sales scaling or marketing efforts, ideal for showcasing trend stability and operational maturity.
Visualization:
A bar chart was created to emphasize this month-by-month growth, with a clear gradient from lower revenue early in the year to higher values in Q4.