📊 Northwinds Sales Dashboard – Databricks SQL
This interactive dashboard provides a comprehensive view of Northwinds sales data using Databricks SQL, dynamic filtering, and data visualizations.
🔧 Tools & Techniques:
Platform: Databricks SQL on Microsoft Azure
Languages: SQL
Features Used: Window functions, CTEs, dynamic parameter filtering, KPI scorecards, line/bar charts
🧩 Interactive Filters:
Region
Country
Year
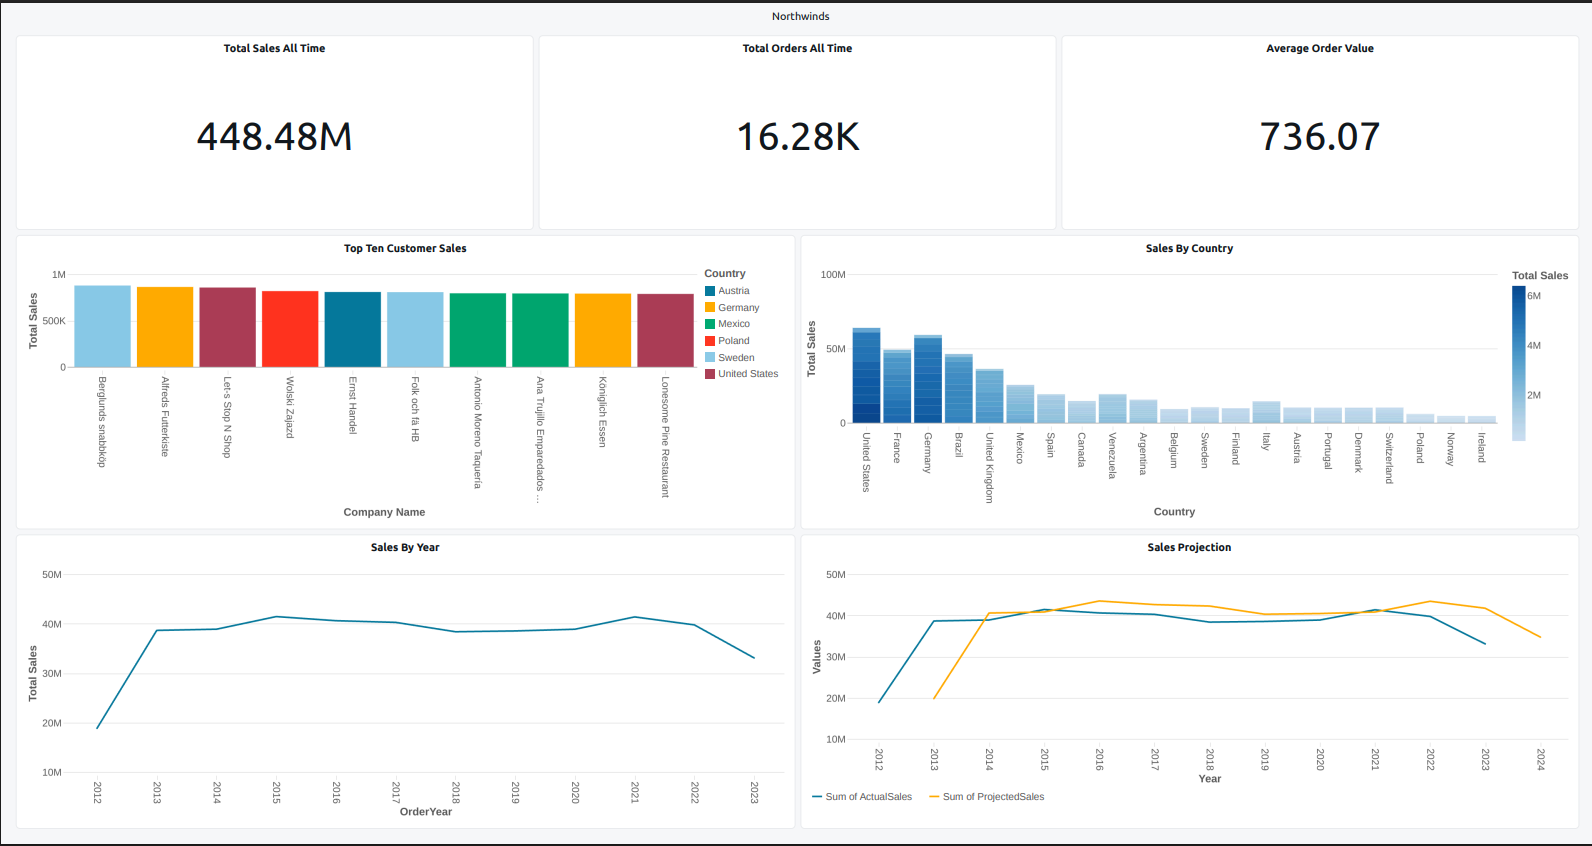
🔢 Key Performance Indicators (KPIs):
Total Sales All Time: $448.48M
Total Orders: 16.28K
Average Order Value: $736.07
📈 Visual Components:
Top 10 Customer Sales: Highlights top companies by revenue
Sales by Country: Breaks down total sales geographically
Sales by Year: Displays yearly sales trends
Sales Projection: Uses prior-year growth rates to forecast future performance
🔄 Dynamic Filtering:
All visualizations respond to global filter parameters, allowing real-time adjustments based on selected region, country, and year. This ensures flexible analysis across both current performance and historical trends.
📌 Purpose:
The dashboard is designed to simulate a real-world executive overview for sales leadership, allowing quick insight into revenue contributors and market distribution, as well as forecasting support.